Introduction
There are several tool available in Wireshark that will greatly enhance your ability to troubleshoot network issues using Wireshark. Three of the most widely used tools are:
a) Capture File Properties
b) Expert Information
c) Conversations tools
All samples in this document was captured using the 3.2.6 version of Wireshark.
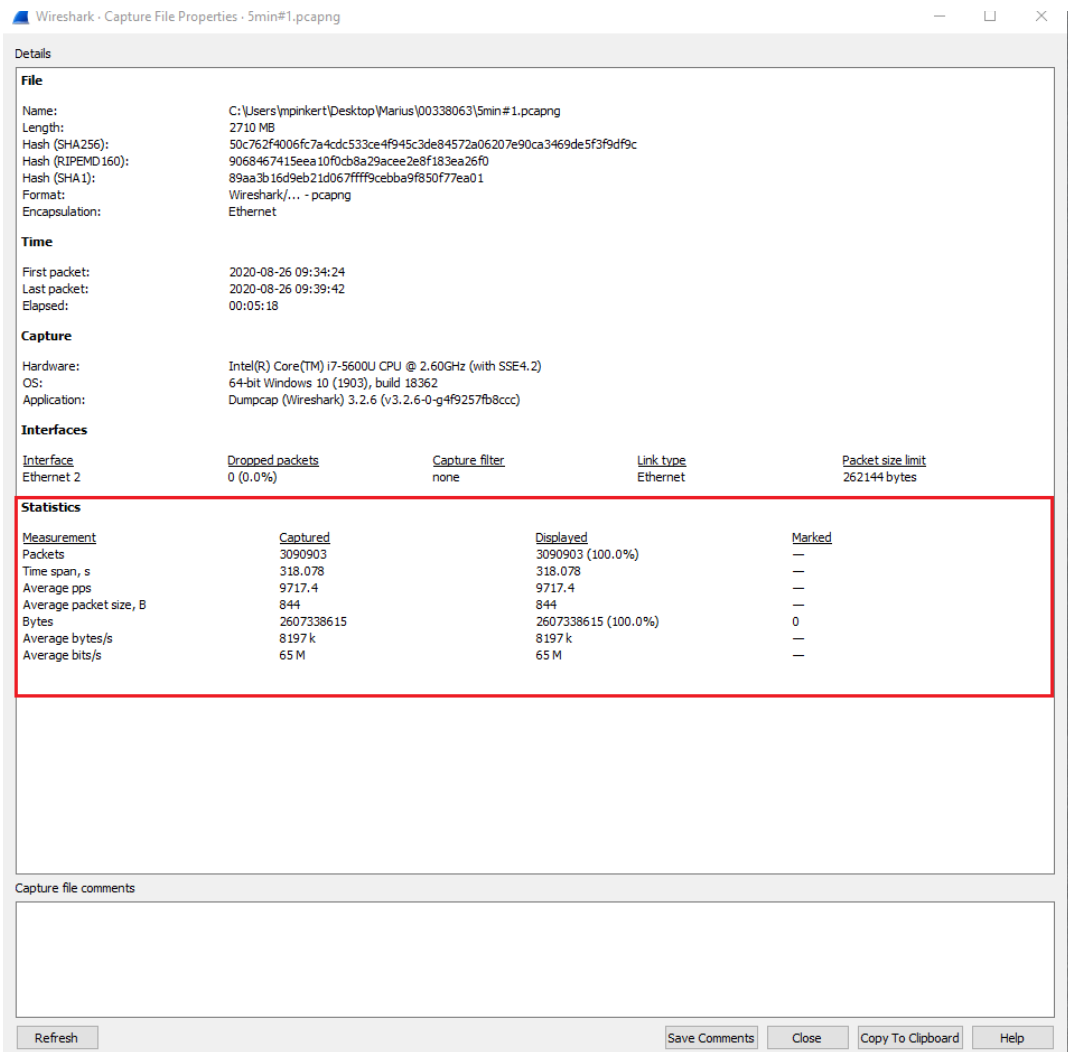
Wireshark File Properties Tool
This tool provided general information about the current capture file. In the area enclosed in RED, you can find a statistical summary of the traffic captured in the trace being processed.
NOTE: If a display filter is set, you will see values in the Captured column, and if any packets are marked, you will see values in the Marked column. The values in the Captured column will remain the same as before, while the values in the Displayed column will reflect the values corresponding to the packets shown in the display. The values in the Marked column will reflect the values corresponding to the marked packages.
Expert Information Tool
Expert information is the starting point for your investigation, not the end point. Every network is different. So it’s up to you to verify that Wireshark’s expert information applies to your individual network deployments. The presence of expert information doesn’t necessarily indicate a problem and absence of expert information doesn’t necessarily mean everything is OK. It’s a tool that keeps track of any anomalies and other items of interest it finds in a capture file and shows them in the Expert Information dialog. This information may be used to quick find leads that can be used to narrow down or remove possibilities while troubleshooting network issues.
Expert information items have a severity levels assigned. The following levels used by this tool are shown below from lowest to highest severity.
Chat (Blue)
Information about usual workflow, e.g. a TCP packet with the SYN flag set.
Note (Lt. Blue)
Notable events, e.g. an application returned a common error code such as HTTP 404.
Warn (Yellow)
Warnings, e.g. application returned an unusual error code like a connection problem.
Error (Red)
Serious problems, such as malformed packets.
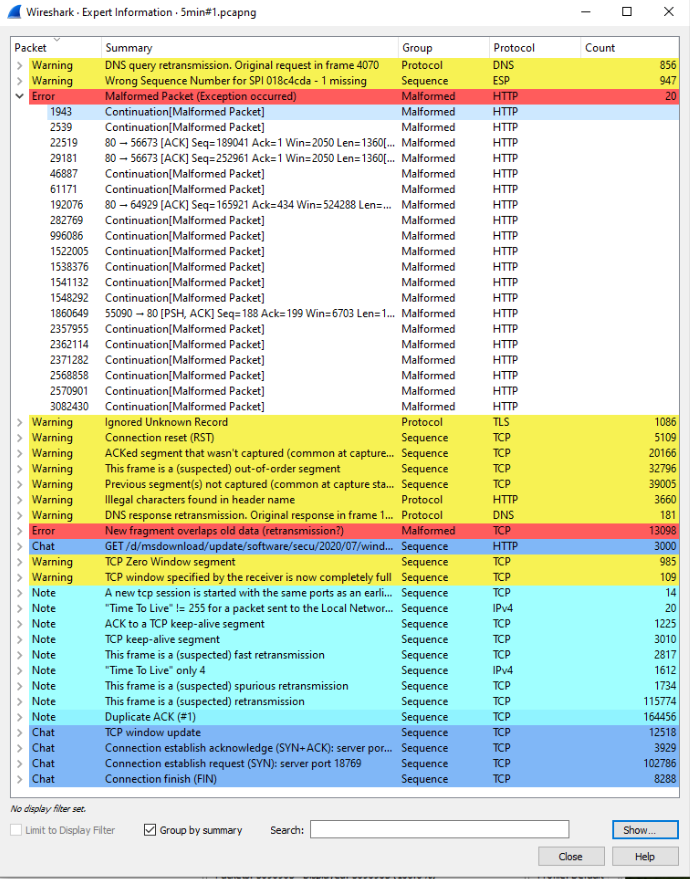
In the sample below, you can see the anomalies or abnormalities identified by the Wireshark Expert Information tool along with the number of occurrences of each irregularity. Clicking on the greater than sign to the left of an occurrence presents a drop-down page with a list of packets with the selected irregularity.
Clicking on one of the packets listed in this drop-down page will navigate you to this occurrence in the traffic capture as seen below:
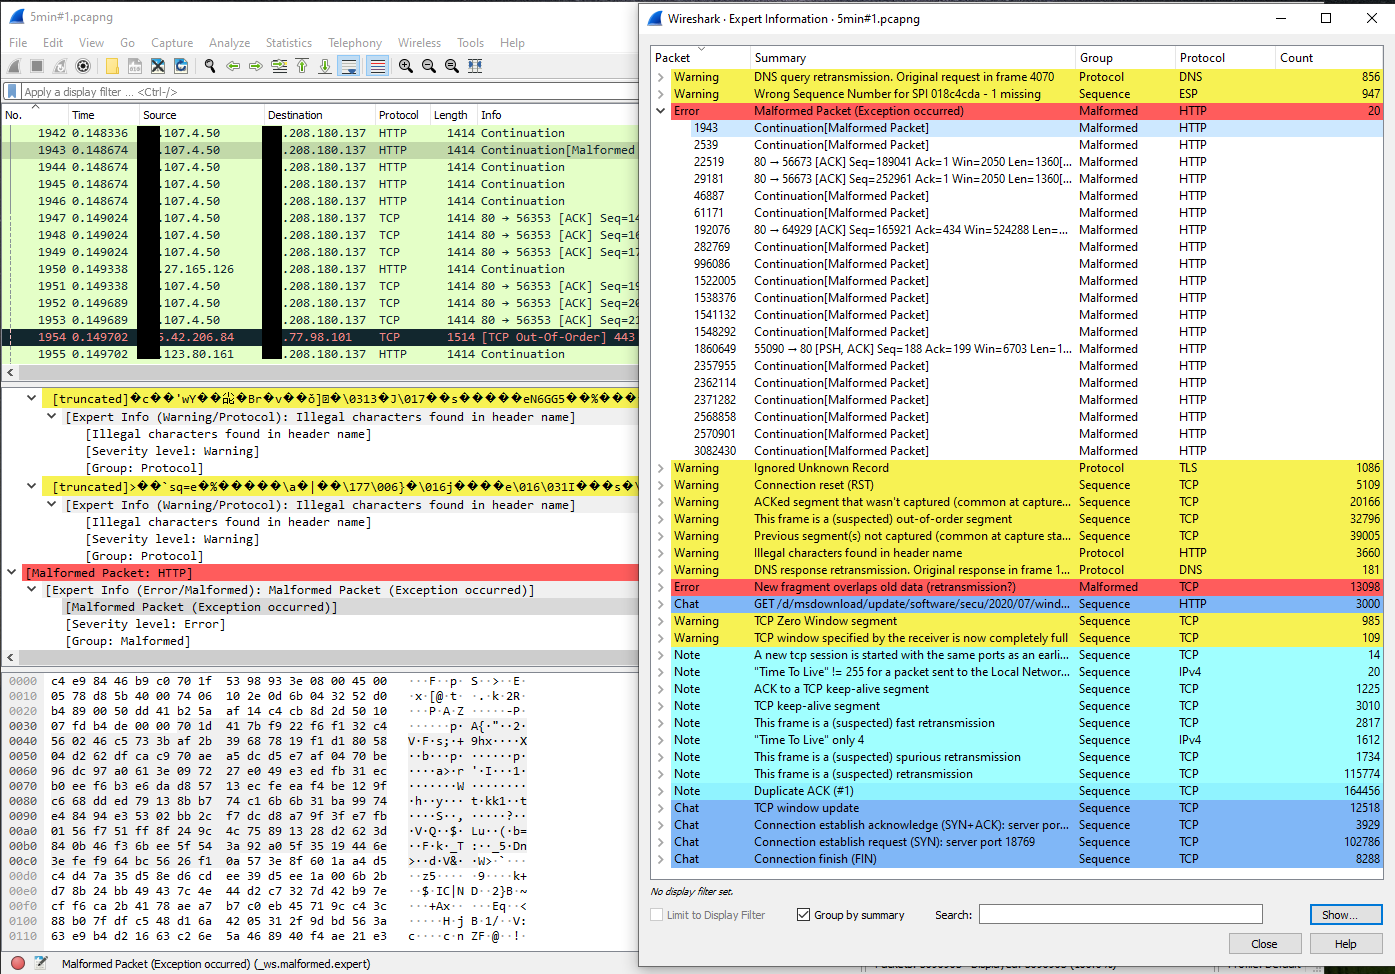
Remember, this tool will not provide you with the root cause of the issue you are working on but a quick view of odd behavior within the traffic capture and a list of leads to help guide your troubleshooting direction towards problem identification/resolution.
Conversations
Another useful tool in Wireshark is the Statistics Conversation tool. A network conversation is the traffic between two endpoints. The information provided includes addresses, packet counters, and byte counters. The conversation window also adds four columns: The start time of the conversation (“Rel Start”) or (“Abs Start”), the duration of the conversation in seconds, and the average bits (not bytes) per second in each direction.
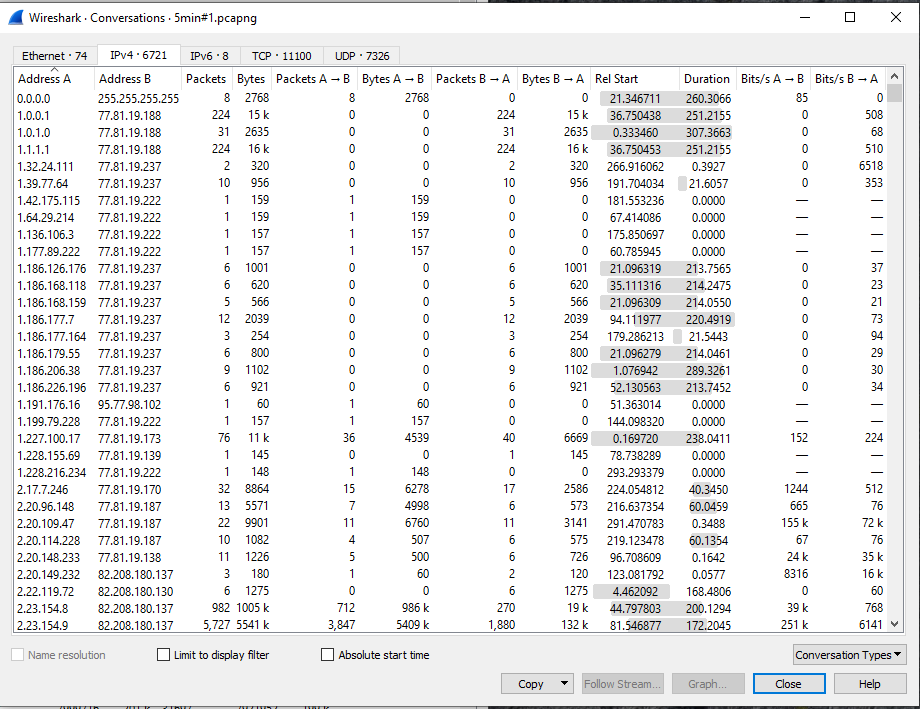
You have the option to look between layer 2 Ethernet statistics, layer 3 IP statistics, or layer 4 TCP or UDP statistics.
You can use this statistics tools to help troubleshoot:
- On layer 2 (Ethernet): To find and isolate broadcast storms
- On layer 3/layer 4 (TCP/IP): To connect in parallel to the internet router port, and check who is loading the line to the ISP
For more information on Wireshark usage and available tools within Wireshark, go the this URL: https://www.wireshark.org/docs/wsug_html/