Introduction
In this article there are a list of possible issue that may impact the network performance.
Traffic Congestion
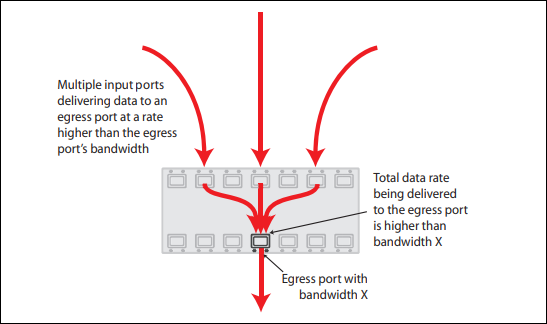
Congestion happens when a switch receive more traffic designated for a port than it can handle, the traffic will have to be queued to be forwarded.
-
Indication of congestion:
Run command
show platform port portx.y.z counters on ingress ports
awplus# show platform port port1.0.1 counters ↓

 Switch Port Counters
--------------------------------------------------------------------------

Port port1.0.1 Ethernet MAC counters:
 Combined receive/transmit packets by size (octets) counters:
  64                               0 1024 - MaxPktSz                  0
  65 - 127                         0 1519 - 1522                      0
  128 - 255                        0 1519 - 2047                      0
  256 - 511                        0 2048 - 4095                      0
  512 - 1023                       0 4096 - 9216                      0

 General Counters:
 Receive                             Transmit
  Octets                           0 Octets                           0
  Pkts                             0 Pkts                             0
  FCSErrors                        0
  MulticastPkts                    0 MulticastPkts                    0
  BroadcastPkts                    0 BroadcastPkts                    0
  PauseMACCtlFrms                  0 PauseMACCtlFrms                  0
  OversizePkts                     0
  Fragments                        0
  Jabbers                          0
  UnsupportOpcode                  0
  AlignmentErrors                  0
  SymErDurCarrier                  0
  CarrierSenseErr                  0
  UndersizePkts                    0
                                     FrameWDeferrdTx                  0
                                     FrmWExcesDefer                   0
                                     SingleCollsnFrm                  0
                                     MultCollsnFrm                    0
                                     LateCollisions                   0
                                     ExcessivCollsns                  0
                                     Collisions                       0

 Layer 3 Counters:
  ifInUcastPkts                    0 ifOutUcastPkts                   0
  ifInDiscards                     0 ifOutErrors                      0
  ipInHdrErrors                    0

 Miscellaneous Counters:
  DropEvents                       0
  ifOutDiscards                    0
  MTUExcdDiscard                   0
If
ifInDiscards is greater than 0 that indicates there congestion downstream and packets have to be discarded due to the destination port is unable to keep up with high data rate.
Execute
show mls qos interface portx.y.z queue-counters
awplus> show mls qos interface port1.0.12 queue-counters ↓
Interface port1.0.12 Queue Counters:
  Port queue length       22
  Egress Queue length:
    Queue 0                0
    Queue 1                0
    Queue 2               23
    Queue 3                0
    Queue 4                0
    Queue 5                0
    Queue 6                0
    Queue 7                0
If one of the queue regularly have non-zero values then the port is oversubscribed.
Implement of quality of service (QoS) can help lessen the impact on time sensitive traffic such as voice and video streaming. In case of streaming from a single source, multicast can be considered to save bandwidth. Last but not least, channel group can group multiple ports together, providing increased total bandwidth as well as redundancy.
Below example put port 1.0.1 through 1.0.4 into a channel group
awplus(config)# interface port1.0.1-port1.0.4 ↓
awplus(config-if)# channel-group 1 mode active ↓
Repeat this configuration on down stream switch and connect those ports together will increase the bandwidth limit between those 2 switches.
Packet Corruption
Corruption happens when there is source of interference or hardware fault between 2 devices that cause error and the packet will be dropped and will have be resent.
This would be equivalent of package gets damaged during shipment and has to be resent.

-
Indication of corruption:
Run command
show platform table port portx.y.z counters
awplus# show platform port port1.0.1 counters ↓

 Switch Port Counters
--------------------------------------------------------------------------

Port port1.0.1 Ethernet MAC counters:
 Combined receive/transmit packets by size (octets) counters:
  64                               0 1024 - MaxPktSz                  0
  65 - 127                         0 1519 - 1522                      0
  128 - 255                        0 1519 - 2047                      0
  256 - 511                        0 2048 - 4095                      0
  512 - 1023                       0 4096 - 9216                      0

 General Counters:
 Receive                             Transmit
  Octets                           0 Octets                           0
  Pkts                             0 Pkts                             0
  FCSErrors                        0
  MulticastPkts                    0 MulticastPkts                    0
  BroadcastPkts                    0 BroadcastPkts                    0
  PauseMACCtlFrms                  0 PauseMACCtlFrms                  0
  OversizePkts                     0
  Fragments                        0
  Jabbers                          0
  UnsupportOpcode                  0
  AlignmentErrors                  0
  SymErDurCarrier                  0
  CarrierSenseErr                  0
  UndersizePkts                    0
                                     FrameWDeferrdTx                  0
                                     FrmWExcesDefer                   0
                                     SingleCollsnFrm                  0
                                     MultCollsnFrm                    0
                                     LateCollisions                   0
                                     ExcessivCollsns                  0
                                     Collisions                       0

 Layer 3 Counters:
  ifInUcastPkts                    0 ifOutUcastPkts                   0
  ifInDiscards                     0 ifOutErrors                      0
  ipInHdrErrors                    0

 Miscellaneous Counters:
  DropEvents                       0
  ifOutDiscards                    0
  MTUExcdDiscard                   0
If the output above in bold have a large number of counters, it indicates either the cable connected to the port is fault or the port on the other end of cable is faulty.
Ethernet cable tester or Optic fiber tester can help rule out faulty cable. Fiber connecters can be cleaned to reduce noise.
If cable tester is not available, running command
test cable-diagnostic interface tdr interface portx.y.z can provide an rough idea of the status of the cable.
Alternatively a direct connection can be used to rule out fault on the switch or ports.
Example:
Below example shows
test cable-diagnostic interface tdr interface port1.0.1 as well as the result
awplus# test cable-diagnostics tdr interface port1.0.1 ↓
Link will go down while test is in progress. Continue? (y/n): y ↓
Test started. This will take several seconds to complete. Use "show test cable-diagnostics tdr" to print results.
awplus# show test cable-diagnostics tdr ↓
Last test run at Wed May 28 12:06:12 2014

Port     Pair  Length       Status
-------------------------------------------------
1.0.3    A     -            OK
         B     -            OK
         C     -            OK
         D     -            OK
Collision
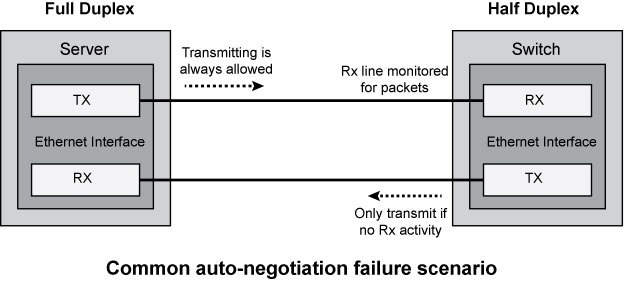
Collision happens when 2 device trying to send data on the same ping/strand of fiber. Although collision no longer happen with full duplex connection, if the duplex configuration happens to mismatch between ports, the full duplex port can be sending data down the ping half duplex using to both send/receive and cause Collision to happen.
Run command
show platform table port portx.y.z counters
awplus# show platform port port1.0.1 counters ↓

 Switch Port Counters
--------------------------------------------------------------------------

Port port1.0.1 Ethernet MAC counters:
 Combined receive/transmit packets by size (octets) counters:
  64                               0 1024 - MaxPktSz                  0
  65 - 127                         0 1519 - 1522                      0
  128 - 255                        0 1519 - 2047                      0
  256 - 511                        0 2048 - 4095                      0
  512 - 1023                       0 4096 - 9216                      0

 General Counters:
 Receive                             Transmit
  Octets                           0 Octets                           0
  Pkts                             0 Pkts                             0
  FCSErrors                        0
  MulticastPkts                    0 MulticastPkts                    0
  BroadcastPkts                    0 BroadcastPkts                    0
  PauseMACCtlFrms                  0 PauseMACCtlFrms                  0
  OversizePkts                     0
  Fragments                        0
  Jabbers                          0
  UnsupportOpcode                  0
  AlignmentErrors                  0
  SymErDurCarrier                  0
  CarrierSenseErr                  0
  UndersizePkts                    0
                                     FrameWDeferrdTx                  0
                                     FrmWExcesDefer                   0
                                     SingleCollsnFrm                  0
                                     MultCollsnFrm                    0
                                     LateCollisions                   0
                                     ExcessivCollsns                  0
                                     Collisions                       0

 Layer 3 Counters:
  ifInUcastPkts                    0 ifOutUcastPkts                   0
  ifInDiscards                     0 ifOutErrors                      0
  ipInHdrErrors                    0

 Miscellaneous Counters:
  DropEvents                       0
  ifOutDiscards                    0
  MTUExcdDiscard                   0
If the out above in bold has large amount of counter then it indicates there is collision occurs on this link.
If there is a duplex mismatch, the configuration on the port can be changed to match other device's duplex setting.
The example below sets port1.0.1's duplex to half.
awplus(config)# interface port1.0.1 ↓
awplus(config-if)# duplex half ↓
Topology change
When the switch are running STP, the logical topology is determined by the protocol blocking and unblocking redundant ports. The network will go through relearn phase and cause congestion briefly.
Topology change flushes FDB table and cause switch need to relearn MAC addresses as well as blocking the port for transaction phases, cause congestion.
-
Indication of excessive topology change:
Run command
terminal monitor then
debug mstp topology-change
awplus#terminal monitor
awplus#debug mstp topology-change interface port1.0.4
10:09:09 awplus MSTP[1409]: Topology change rcvd on port1.0.4 (internal)
10:09:09 awplus MSTP[1409]: Topology change rcvd on MSTI 1 port1.0.4
awplus#debug mstp topology-change interface port1.0.6
10:09:29 awplus MSTP[1409]: Topology change rcvd on port1.0.6 (external)
10:09:29 awplus MSTP[1409]: Topology change rcvd on MSTI 1 port1.0.6
The output in terminal will indicate where is the topology change coming from.
A counter of TCN can be find with
show spanning-tree statistics
awplus# show spanning-tree statistics ↓

                Port number = 905 Interface = port1.0.1
                ================================
% BPDU Related Parameters
% -----------------------
% Port Spanning Tree                 : Enable
% Spanning Tree Type                 : Rapid Spanning Tree Protocol
% Current Port State                 : Forwarding
% Port ID                            : 8389
% Port Number                        : 389
% Path Cost                          : 20000
% Message Age                        : 0
% Designated Root                    : 00:00:cd:28:06:b4
% Designated Cost                    : 0
% Designated Bridge                  : 00:00:cd:28:06:b4
% Designated Port Id                 : 8389
% Top Change Ack                     : FALSE
% Config Pending                     : FALSE

% PORT Based Information & Statistics
% -----------------------------------
% Config Bpdu's xmitted              : 443
% Config Bpdu's received             : 2
% TCN Bpdu's xmitted                 : 3
% TCN Bpdu's received                : 0
% Forward Trans Count                : 2

% STATUS of Port Timers
% ---------------------
% Hello Time Configured              : 2
% Hello timer                        : ACTIVE
% Hello Time Value                   : 0
% Forward Delay Timer                : INACTIVE
% Forward Delay Timer Value          : 0
% Message Age Timer                  : INACTIVE
% Message Age Timer Value            : 0
% Topology Change Timer              : INACTIVE
% Topology Change Timer Value        : 0
% Hold Timer                         : INACTIVE
% Hold Timer Value                   : 0

% Other Port-Specific Info
  ------------------------
% Max Age Transitions                : 1
% Msg Age Expiry                     : 0
% Similar BPDUS Rcvd                 : 0
% Src Mac Count                      : 1
% Total Src Mac Rcvd                 : 2
% Next State                         : Discard/Blocking
% Topology Change Time               : 0
The bold part of above output indicates how many TCN has been received or transmitted.
Once the source of the topology change is identified, action can be taken accordingly. The source can be experiencing a network issue, such as a flapping port, If this is the case, troubleshoot the network issue.
If the source is not expected to be a part of network, topology change notification can be blocked.
In the example below interface port 1.0.8 will not be processing any STP related message, including topology change notification.
awplus(config)# interface port1.0.8 ↓
awplus(config-if)# spanning-tree portfast bpdu-filter
High CPU utilization
The CPU utilization of switch is not directly related the rate of the traffic being forwarded by the switch, however the cause of high CPU utilization can be a result of anomaly in the network. (eg: excessive broadcasting packets) High CPU utilization can also happens in a stack configuration as the master's CPU being tasked more load.
-
Indication of high CPU useage:
Run command
show cpu
awplus> show cpu ↓
CPU averages:
 1 second: 3%, 20 seconds: 0%, 60 seconds: 3%
System load averages:
 1 minute: 0.00, 5 minutes: 0.00, 15 minutes: 0.00
Current CPU load:
 userspace: 1%, kernel: 0%, interrupts: 0% iowaits: 0%

...output omitted...
If the system load averages is larger than 1 it indicates some process had to be queued to be processed.
Alternatively command
show cpu history provides three graph over time:
awplus> show cpu history ↓
Per second CPU load history

100
 90
 80
 70
 60
 50
 40
 30
 20
 10 ************************************************************
    |....|....|....|....|....|....|....|....|....|....|....|....
    Oldest                                                Newest
        CPU load% per second (last 60 seconds)
              * = average CPU load%


Per minute CPU load history

100
 90
 80
 70
 60
 50
 40
 30
 20
 10                                                *****+*******
    |....|....|....|....|....|....|....|....|....|....|....|....
    Oldest                                                Newest
        CPU load% per minute (last 60 minutes)
              * = average CPU load%, + = maximum


Per (30) minute CPU load history

100
 90
 80
 70
 60
 50
 40
 30
 20
 10                                                            +
    |....|....|....|....|....|....|....|....|....|....|....|....
    Oldest                                                Newest
        CPU load% per 30 minutes (last 60 values / 30 hours)
              * = average, - = minimum, + = maximum
If the CPU utilization goes above 50% then it may start to experience performance issue.
Other than identify network anomaly and correct it via means such as correct loop in the network or setup storm control for excess broadcasting traffic, it is recommended to reduce non-core functionalities such as monitoring to reduce the CPU usage.